Specification and Modification of Graph Display Range
How to set the axis of measurement results in the software of WM1000 and WM2000 series is explained.
WM2000 series have windows displayed by streaming during measurement and windows specialized for displaying measurement results.
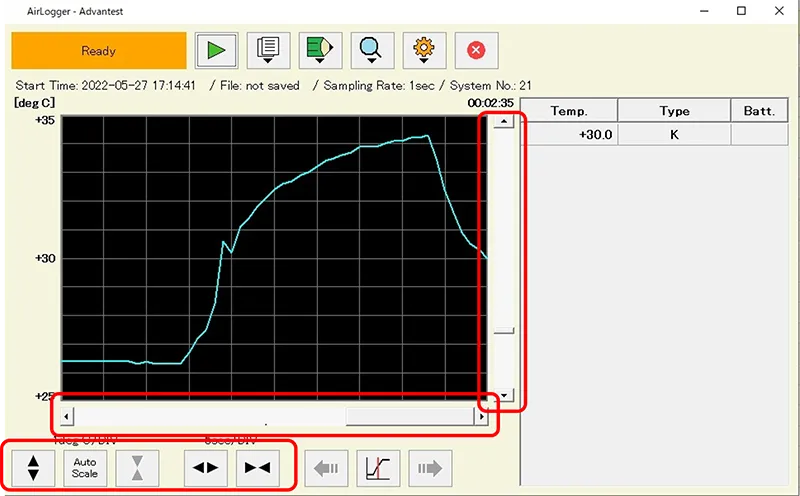
WM1000 Standard Software
- To expand or reduce the range of X axis, clicking on
 for expandion and
  for reduction is possible, keeping the central value fixed.
 - To expand or reduce the range of Y axis, clicking on
 for expandion and
  for reduction is possible, keeping the central value fixed.
 - The range of the Y axis can be optimized to meet the X axis displayed, by using
 .
. - The position of the displayed graph can be moved freely by using the bars along the graph.
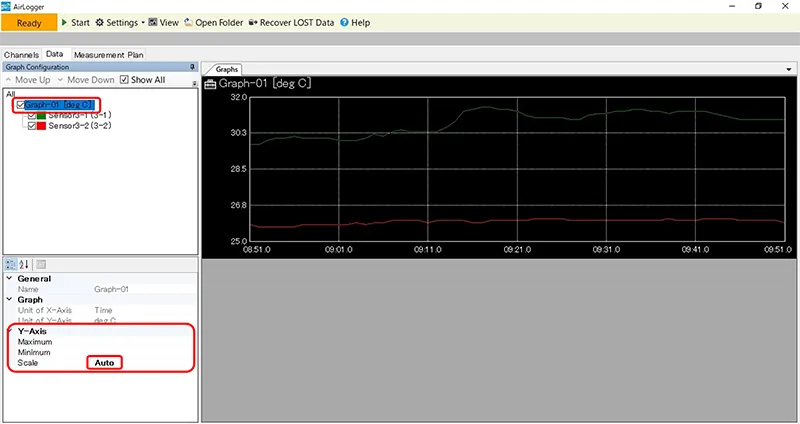
WM2000 Standard Software
Main Window
Main window has the function of displaying the graph to check measurement values easily and its functions for the graph are limited.
When confirming details, please use the data display window.
-
To specify the range of the Y axis, select the graph name of the tree in ‟Graph Configuration” shown in the left side of the graph below and set each item.
To change the range of the display, click on ‟Graph-01” of ‟Graph Configuration” to display the actual configuration of the Graph-01.
Change ‟Auto” to ‟Manual”.
The maximum and minimum values of Y axis will be displayed, so input new values. -
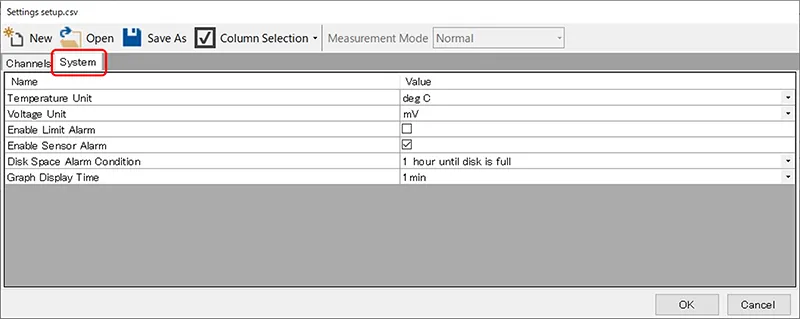
The X axis cannot be changed during measurement.
The display range of the X axis can be set by “[Graph Display Time]” in the tab “[Setup…]” with setting “[System]” before measurement.
Previous data displaying cannot be viewed backward due to displaying streaming data.
If confirming backward, click on “View” button to pop out the data display window.
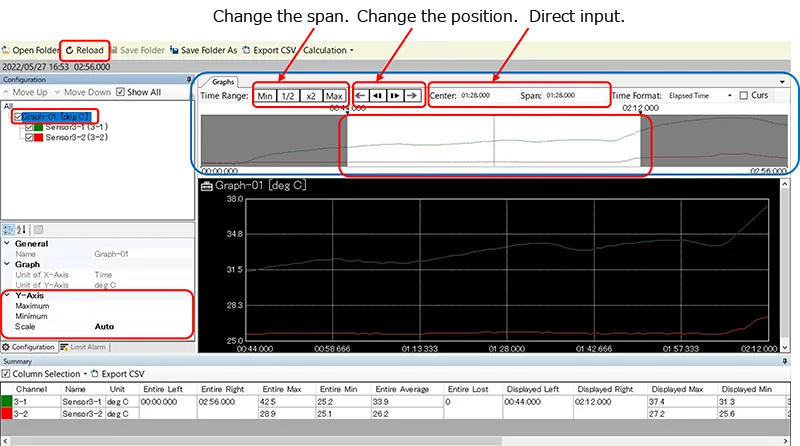
Data Display Window
The data display window can be opened by clicking on “View” button, or on “Open Folder” button in the main window.
It can read log of measured data and display them as graphs.
To display data log during measurement, the latest data can be displayed by clicking on “[Reload]” to update.
The graph of the data display window has two display windows, simple graph window to show the whole graphs (blue frame in the graph) and detailed graph window.
The axis of the simple graph window cannot be changed because it is adjusted automatically to display all graphs.
-
To set the specified range of the Y axis, set each item by selecting name with the tree in “Configuration” shown left side of the graph below.
If changing the display range of Graph-01, click on “Graph-01” of “Configuration” to display the actual configuration of Graph-01 under the frame and change “Auto” to “Manual” to be able to display maximum and minimum values of the Y axis. By specifying the values, the Y axis can be changed.
The display range of the X axis is the white background part in the simple display.
- By dragging the terminals of the white part, Starting point/ End point can be changed. By clicking on part except the terminals and sliding, the center point can be changed.
- There are buttons to change span keeping the center and change position keeping the width.
- The specification can be operated by inputting data in the cells of “Center” and “Span” directly.