How to Customize Graph Display
Dividing Graph
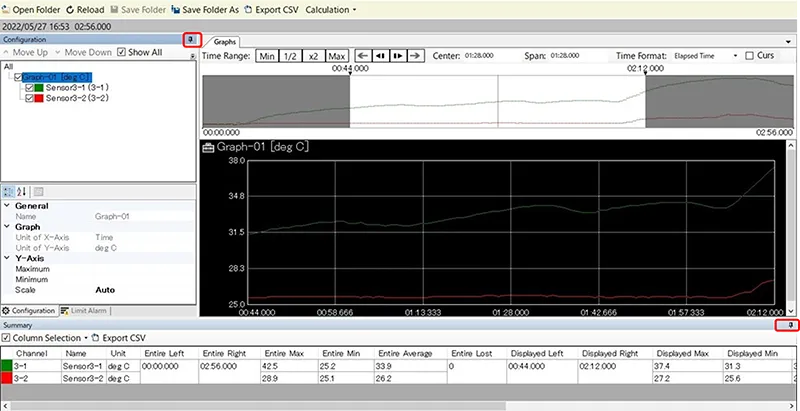
- In normal configuration, the graphs divided per types of units are displayed.
- The channels having the same unit can divide (unite) the graphs of measurement results.
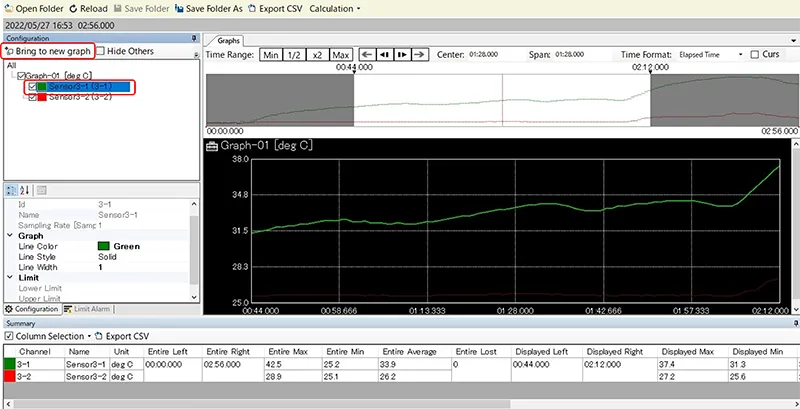
- To divide a graph, click on the channel to divide from the tree of ‟configuration” then, “[Bring to new graph]” is displayed. Click it to pop out new graph.
- In order to move other channels to the new graph, drag and drop (with clicking, drag them to the graph to move and drop them there) them.
Change Order of Displayed Graphs
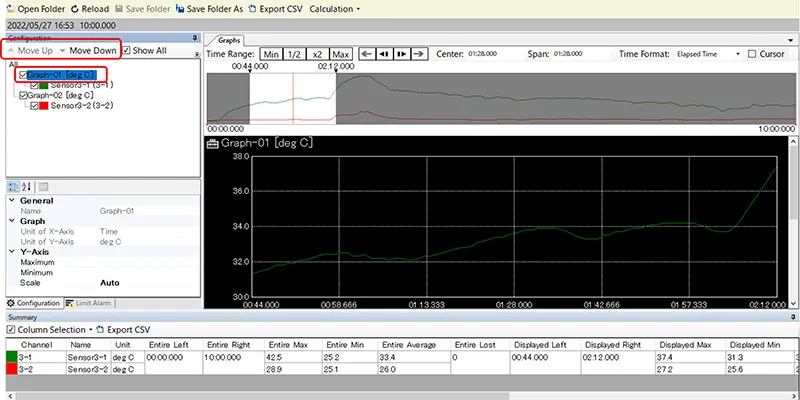
Click on the graph, to display the configuration for changing position of the graph.
- “Move Up” can move the graph to one higher level.
- “Move Down” can move the graph to one lower level.
Expansion and Reduction of Graph Display Range
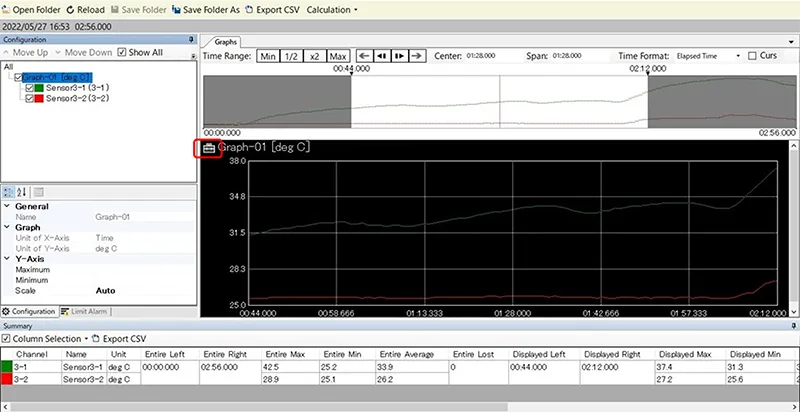
There is a mark  on upper left of each graph.
When hovering the cursor over it, the menu icon is popped out, selecting the largeness of the graph either 2 times or half time can be selected, and changing the largeness of the graph in the window to vertical direction is available.
Note: If you click on  , the menu icon cannot be popped out.
Maximization of Displaying Graph
The graph under the data display window and the tree of the graph contents in left side can be minimized to widen the part of the graph display.
Click on “Pin”, to clear fixing the display and minimize the tree.